For a particular case I’ve got a lot of HGV movements all over Europe from point A to point B. In order to manage all the data properly, in the data I added a unique ID so I know the exact routes after producing directions in ORS.
When excecuting the batch job from both layers, I’ve found a problem with the results.
QGIS handles the ID’s not as a unique number which belong to eachother, but uses the order of row numbers which is quite random.
In the results the route ‘‘from_id’’ towards ‘‘to_id’’ you see this as follows:
Row number 1 = 3 to 6 (HOOGSTRATEN TO HOEGAARDEN and it has to be HOOGSTRATEN TO HOOGSTRATEN )
Row number 2 = 9 to 3 (LEERDAM to HOOGSTRATEN and it has to be LEERDAM TO OOSTERHOUT )
Row number 3 = 1 to 1 (by chance correct)
Etc.
This is not the way I want it. The ‘‘from_id’’ and ‘‘to_id’’ has to be the same in order to produce a correct line which represents the route it drives.
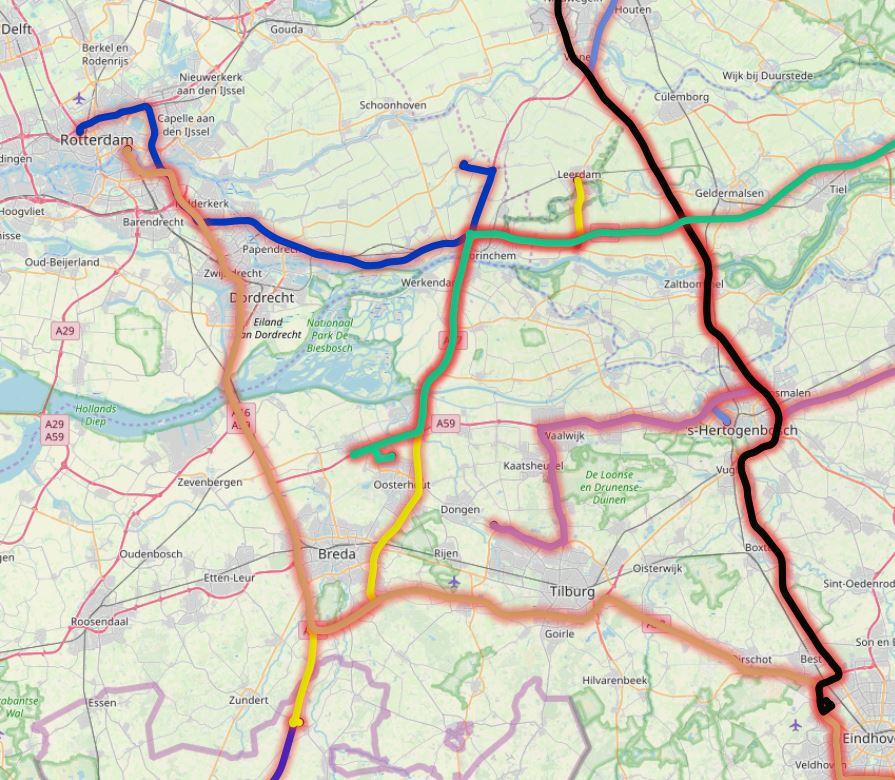
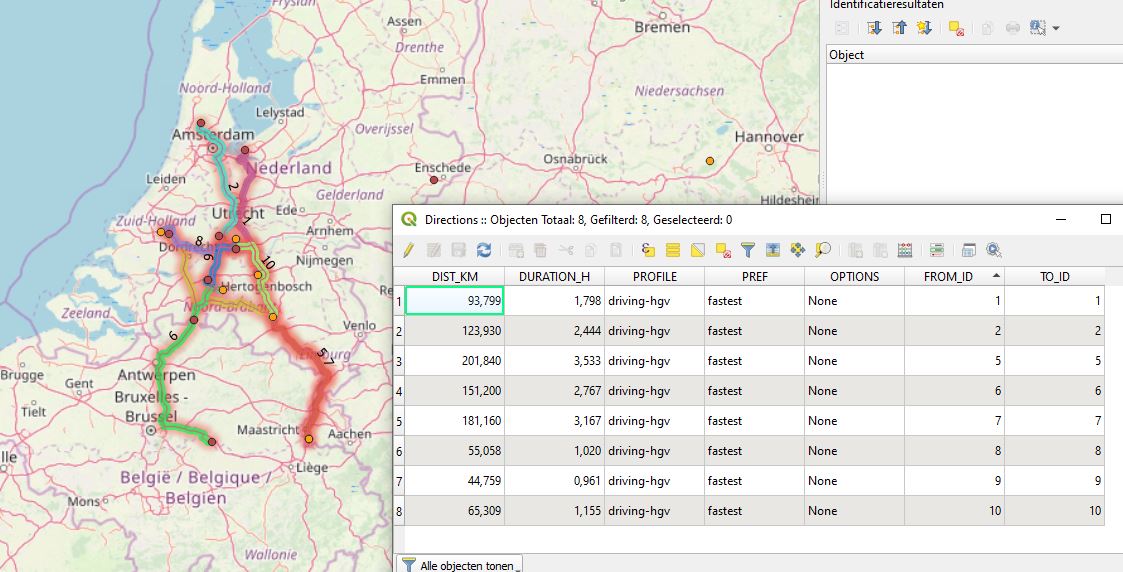
To make it even more clear: in screenshot 1 (as a new member, I only may upload one screenshot) you see the generated directions. Route number 2 has to be from Leerdam to Oosterhout. From Leerdam, the only route it generated is the yellow one. But, you can see it doesn’t go to Oosterhout, but to Hoogstraten in Belgium.
I tried to re-read this now a few times. And I’m still stuck…
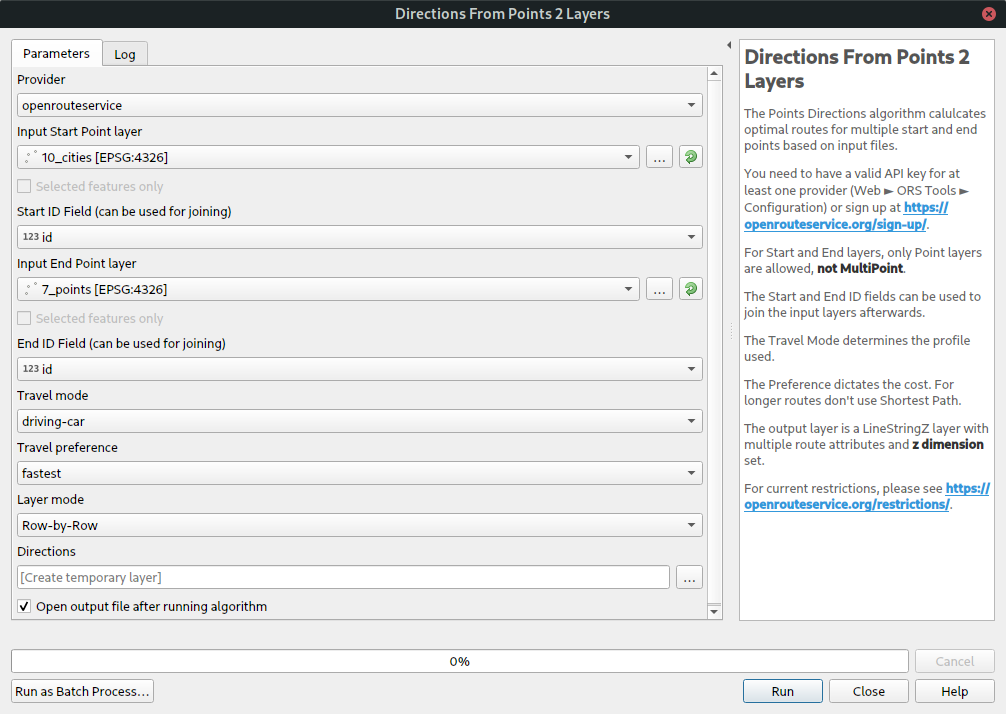
I do think that you don’t use the proper algorithm here. What are these both layers,?
I tell you how the algorithm works:
Both layers have to be point layers and it will calculate from each point in layer A (start) a route to each point in layer B (destination).
I still don’t know what you’re trying to do, but it doesn’t seem like what I just described.
Thanks for the fast respons. I stay trying untill we understand eachother
The algoritms does work, but in my opinion not the right way. Or I do indeed something wrong. In short: the directions it’s producing are random.
I use two layers:
A point layer with ‘‘loading locations’’ with an ID, a zipcode, the name of the municipality and the amount of times this route is driven;
A point layer with ‘‘unloading locations’’ with an ID, a zipcode, the name of the municipality and the amount of times this route is driven;
Each route is signatured by an ID. Like ID = 1 in the loading locations has to go to ID = 1 in the unloading locations.
The result of route 1 is that is has to go from point A to point B (like corresponding ID’s as you say), but it goes from point A to E/K/Z for example but not to the exact B location I want. I’m using row by row. The all by all will work because it’s calculating all the options, but with the great amount of data that isn’t realistic to calculate.
The result has to be a unique line with the amount of routes the company is traveling. The next step is to see which road the company is using the most often.
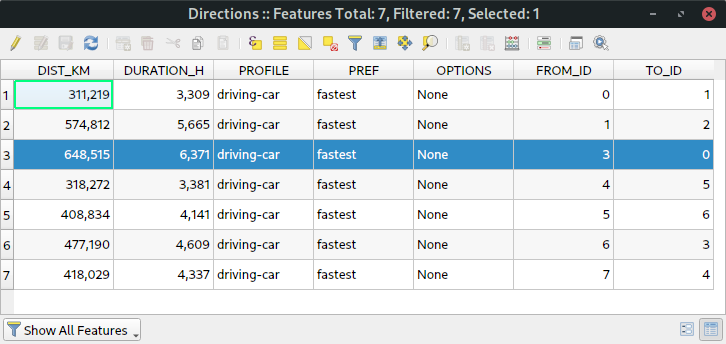
Thanks for testing. Can you show the attribute table it’s producing as well?
Maybe I see the problem in the second screenshot again: the yellow line is the highlighted route which goes from point 3 to 0 or vice versa. But why doesn’t this go from 0 to 0 in stead?
Well, that entirely depends what’s in your ID fields… You can see on the TO_IDs, they don’t start with ID 0. That’s because in the TO layer, the values in the ID field don’t start with 0 either. The first feature has ID 1, the second ID 2 and so on. I think you’re confusing FID with ID. I’m not looking at feature IDs in the strict sense, as they can change etc, they wouldn’t be useful to correlate your input to the output. You can join the TO and FROM layers now to the resulting layer’s TO_ID/FROM_ID. That’s the whole point for these fields.
I think what the tool does, is offering a solution for the salesman problem. That isn’t the case for me, but…
I did found a way now to get what I want, almost. I’ve adjusted the CSV by forcing the column order by ID in stead of random. The result is now that the starting point ID is the same as the destination point ID.
One route is problematic because it was on the same place (just few hundred meters away) so no blame on that. The second route is from Stadthagen (DE) to Enschede (NL) and he doesn’t make a direction. Do you know what the problem could be?
No, it doesn’t. It just calculates directions from each point in Layer A to each point in Layer B, row-by-row (i.e. row 1 → row 1, row 2 → row 2 etc) or all rows by all rows (a symmetrical matrix). There’s only 2 points, hence TSP is not applicable.
Really, I still have no clue what you’re trying to do. And I don’t think you don’t quite understand how it’s supposed to work. If you can re-formulate pls.
Ok maybe the case explanation by an example: the beer company Warsteiner is producing beer at their location in Warstein. Therefore they need cans and bottles to put the beer in. Those cans and bottles come from places from 1) somewhere in the Netherlands and 2) somewhere in Belgium. Every day several trucks drive towards Warstein to deliver the stuff.
After the production of beer, the end product will be firstly stored in several distribution centres. From there they will be further distributed to several places, for example supermarkets in France.
I want to make those routes visual because the excel sheet has 100.000+ movements within 6.000 unique routes. To know from where to where the truck is driving, I’ve added an ID to the starting points and end points. They have to be identical otherwises ORS will calculate routes that doesn’t excist. For example: cans from the Netherlands will go straight to the supermarkets in France. Or supermarkets are going to the beer production site. Not relevant directions.
If there is just a minor issue with my point layer, the consequence is that row by row will end up in unexcisting routes. Therefore I’ve added an ID to it, so I can see afterwards if the routes are correct. In my case: From_ID = 1 --> To_ID = 1 is right.
Jaaa, ok, now I get an idea of what you’re trying to do.
In that case you’re using the wrong algorithm. Do this: collect all waypoints for each trip in the right order, give them the same ID (route ID basically), put these points for each route ID in one MultiPoint feature, so that all routes live in the same layer, but each route is only one MultiPoint feature. Then you use the “Directions from 1 Point layer”, which will calculate one route for each MultiPoint feature in the order of its points.
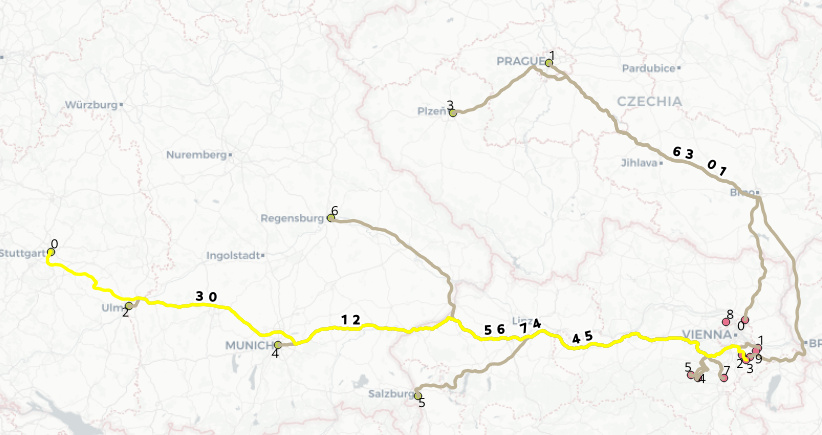
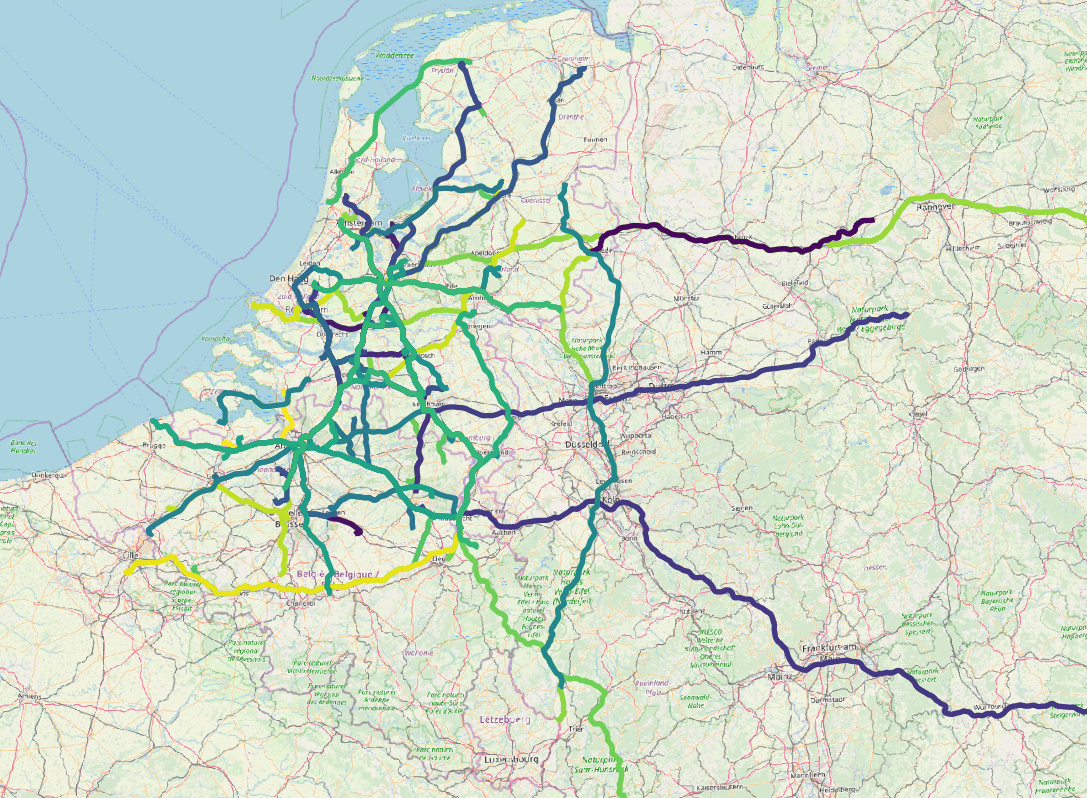
It was a little bit of a struggle, but I think your solution is sufficient! Here the first 100 routes as a result.
Another problem I’ve faced was that the distribution centres and factories were sometimes in the same place. Therefore point A and point B were on the same point, so ORS said I can’t draw a direction.
Nevertheless…I’m not totally there because I want to calculate several thousands of routes but this seems really hopeful.
I will let you know if the rest is also worked out well. For now thank you very much!!!
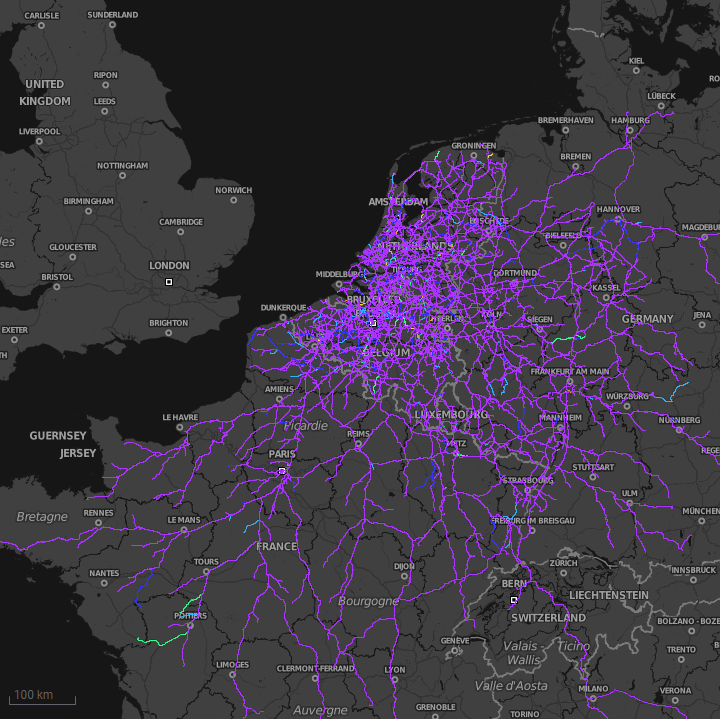
Thank you very much for the help. The result is that there are almost 5.500 routes generated by ORS. Amazing result! Because all the lines are upon eachother, I also made points of it to generate interactive heatmaps.
I maybe have one recommendation: is it possible to build a control mechanism to prevent errors? I had some routes from A to B which were in the same location (one km away, but the same point). Therefore the whole batch did collapse because of that one error.