When hovering the mouse pointer over a planned route in the ORS map display view, a dot appears on the route.
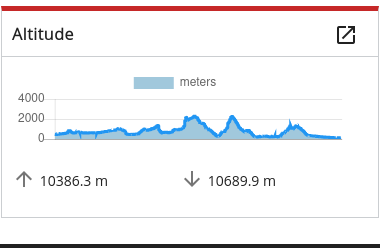
Similarly, when hovering the mouse over the line on the altitude map (elevation profile) view – shown below – a dot also appears, along with a tooltip displaying the altitude.
For some modes of travel - cycling and walking in particular - it could be very helpful if progress dots could appear in both views (synchronized to the corresponding location) at the same time.
That way, a walker could mouseover a summit peak in the altitude view and see how it relates to nearby points of interest, or a cyclist could mouseover a town on their route and see whether reaching it involves a climb or a descent.
(NB: I’m active on GitHub and have some limited web development experience - if this would be a small feature to develop, I’d be glad to try to help with an implementation, especially if a little guidance is available)
Hi @anon61551542,
If you click the

button in the altitude window, you will have the
Leaflet.Heightgraph window as a control added in the bottom right over the map.
If you hover over the graph, it will also show the corresponding position on the route.
In addition you can switch between extra information to show them directly in the elevation profile.
There is a function to also have the points show the other way round (hover over map show point on graph) which is not implemented yet in this client.
Similar the feature of the Heightgraph to highlight parts above a specific height:
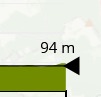
is still using the default color, which is not easy to distinguish from the normal route.
Hope this helps you already
Best regards
1 Like
Very helpful, thank you @amandus - the Leaflet.Heightgraph pop-out display works perfectly for the altitude-to-route case, and it’s also not too difficult to use it to reverse-lookup altitudes for specific route positions.
When time allows I’ll look into the code a bit to see how some of this works in practice.
1 Like
As another thank you / comment : the elevation profile colours for the road surface, waytypes and steepness are an extremely nice feature. To some extent it makes me wonder whether it would be worth considering Leaflet.Heightgraph as the default altitude display, but I guess there may be various UI, accessibility and theming concerns around that.
It was the default in our old client which is still accessible at https://classic-maps.openrouteservice.org
the steepness coloring is also a bit more obvious there.
Feel free to open issues for suggestions in the repository of our new client (if there is none for that topic).
Best regards
Thanks again @amandus. To tell the truth, I prefer the classic interface, for various reasons including the visibility of the route profiling that you mention. That said, I’ve filed a feature request for the responsive interface (and also an issue report about an unrelated observation).
Please note: A similar feature request had previously been logged and closed, but I think that there may still be opportunity for improvement.
(self-reply: the blog post announcing the updated maps interface does a good job of describing the benefits and additional features)
2 Likes